Visual Storytelling: Techniques That Actually Work

Visual storytelling is the practice of using images, video, and graphics to convey a narrative and drive emotion. Our brains process visuals in as little as 13 milliseconds, which makes this approach far more effective than text alone for building memory and action.
Key Takeaways
- storytelling combines clear narrative structure with strategic design to make messages stick.
- The brain processes images roughly 60,000 times faster than text, giving visuals a hard neurological edge.
- After three days, people retain about 65% of information paired with an image versus only 10% from text alone.
- Interactive visual stories consistently outperform static content on time-on-page and bounce rate metrics.
- AI tools like DALL-E 3, Midjourney V6, and Adobe Firefly have made studio-quality visual production accessible to small teams as of 2026.
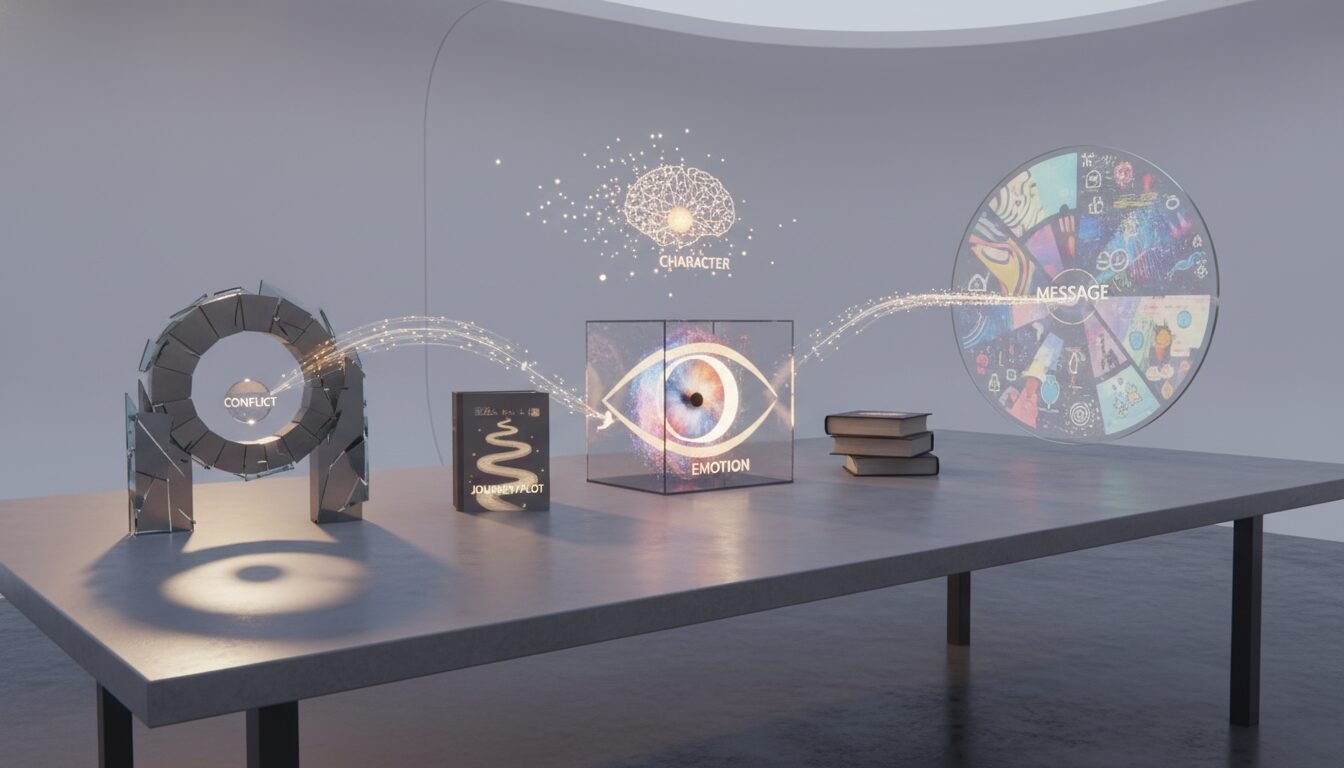
- The best visual narratives follow a setup-conflict-resolution arc, regardless of medium or industry.
What is Visual Storytelling?
this type of storytelling is the practice of using images, graphics, and video to communicate a narrative, and it works because the brain is literally built for it. Unlike text-only content, visuals tap into the brain’s remarkable speed and emotional processing. The Content Marketing Institute defines it as “the method of using graphics, images, videos and photos to engage viewers in order to drive emotions and promote communication.” That dual purpose, to inform and to inspire action, is what separates great visual work from decoration.
This is not a modern invention. Cave paintings in Sulawesi, Indonesia date back more than 35,000 years, where early humans recorded hunting expeditions and spiritual rituals on stone walls. The same impulse drives everything from Instagram Reels to New York Times climate graphics today.
The Neuroscience of Seeing
What makes this kind of storytelling so potent is biology, not trend. An MIT study found that humans process images in as little as 13 milliseconds, eight times faster than previously measured. Beyond speed, roughly 90% of the information transmitted to the brain is visual, and about 65% of people identify as visual learners. These are not marketing talking points. They are the reason visual content dominates every major platform.
Memory retention compounds the advantage. According to resources from the University of Michigan Creative, after three days people remember only about 10% of text but retain roughly 65% when that text is paired with a relevant image. Researchers call this the “picture superiority effect,” and it is the foundation every serious visual communicator builds on.
Distinguishing Visual Storytelling from Visual Art
Not all visual art tells a story. The difference is intentionality and narrative structure. A beautiful photograph captures a moment. visual sequences events to imply conflict, progression, or resolution. In filmmaking, director Bruce Block identifies seven core visual components: space, line, shape, tone, color, movement, and rhythm. Together, these construct a story. The framework applies equally to graphic design, data visualization, and advertising.
Why Visual Storytelling Matters in 2026

storytelling matters more now than ever because attention is the scarcest resource in the digital economy. The formats that win are the ones that communicate the most in the least time, and visuals do that better than any alternative.
The Attention Economy
With attention spans shrinking, grabbing and holding focus is the whole game. Interactive visual stories outperform static content across every measurable dimension: readers spend longer on the page, bounce less often, and click calls-to-action more frequently. According to Shorthand, infographics are shared three times more than any other content type. That is not a small edge. That is a structural advantage worth building a content strategy around.
Emotional Connection and Brand Loyalty
Emotion drives decisions, and this type of storytelling forges emotional bonds through strategic use of color, composition, and movement. Nike’s athlete portraits and Airbnb’s user-generated travel photos are not accidental. They follow a visual hierarchy that prioritizes key messages and removes distractions. As the Content Marketing Institute notes, effective visuals “motivate an audience to take an action,” whether that action is a purchase, a share, or a subscription.
“The most powerful person in the world is the storyteller. The storyteller sets the vision, values, and agenda of an entire generation that is to come.” – Steve Jobs, as cited in multiple design and marketing curricula
Breaking Language and Literacy Barriers
A strong image transcends words, especially in a global economy. Visual narratives bypass linguistic hurdles, making them invaluable for international campaigns. Platforms like TikTok and Instagram thrive almost entirely on this kind of storytelling, proving that universal symbols and gestures convey meaning across cultures without a single word of translated copy.
Core Elements of Powerful Visual Storytelling
Powerful visual rests on three non-negotiable elements: a clear message, sound design principles, and deliberate visual hierarchy. Get all three right and the story almost tells itself.
Craft a Clear, Unified Message
Every successful visual story starts with a precise objective. What do you want your audience to do or feel? The message must be singular and free of clutter. Before selecting any visual, outline your narrative arc: setup, conflict, resolution. I have watched teams skip this step and spend three times as long in revision because the visuals pulled in different directions.
Master Design Principles
Design is the grammar of storytelling. Three pillars stand out:
- Color: Evokes emotion and reinforces identity. Blue conveys trust; red signals urgency.
- Composition: Directs the eye. Techniques like the rule of thirds and leading lines make the focal point unmistakable.
- Typography: Font choice sets the tone. A serif font feels traditional; a clean sans-serif signals modernity.
As of 2026, AI-assisted tools like Canva and Adobe Express help even non-designers apply these principles consistently across dozens of assets in a single session.
Leverage Visual Hierarchy
Visual hierarchy determines the sequence in which information is consumed. By varying size, contrast, and position, you guide the viewer through the story without them realizing it. In a well-built infographic, the headline is the largest element, followed by key statistics in descending order of importance. This prevents cognitive overload and keeps the reader moving forward.
Pros and Cons of Visual Storytelling
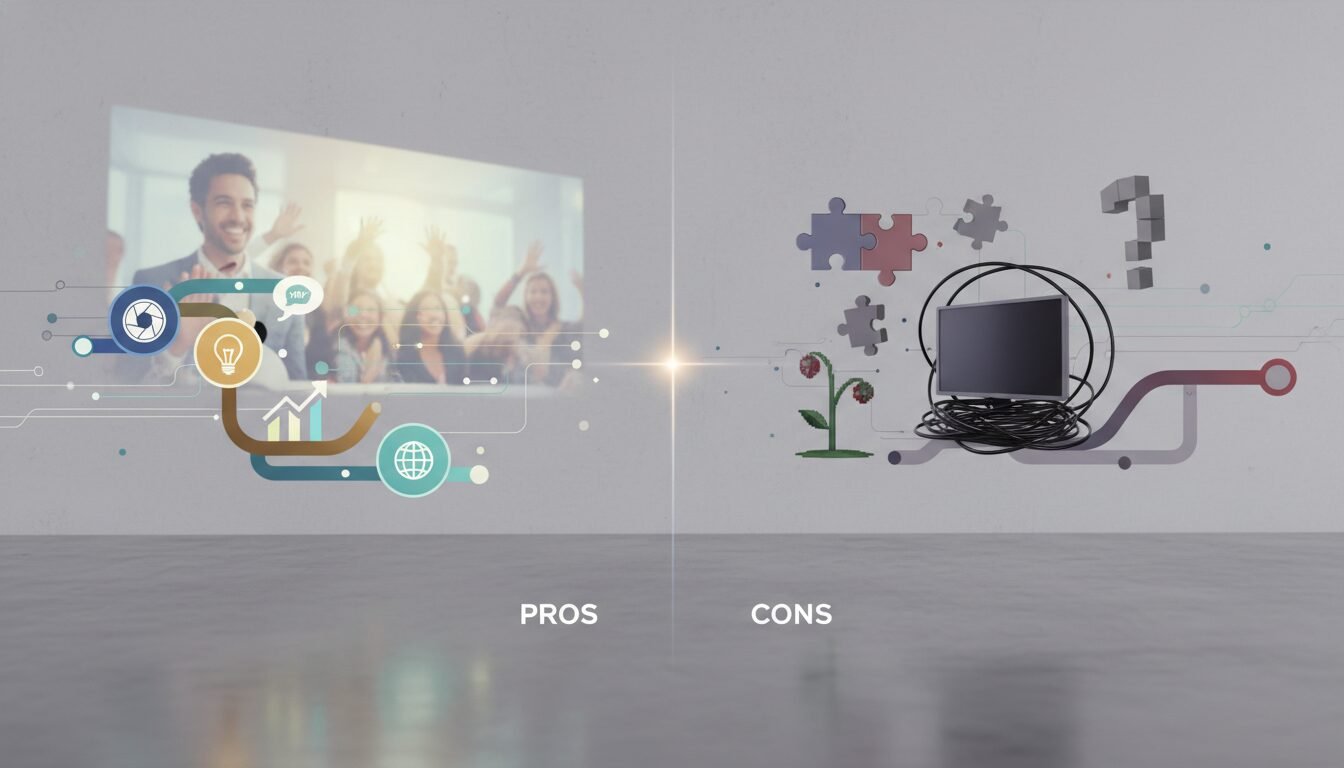
this type of storytelling delivers real advantages, but it also comes with genuine trade-offs worth understanding before you commit budget and time.
Pros
- Faster comprehension: Visuals are processed roughly 60,000 times faster than text, reducing friction for the audience.
- Higher retention: Pairing images with text lifts recall from around 10% to roughly 65% after three days.
- Broader reach: Visual content crosses language barriers and performs well across global platforms.
- Stronger emotional impact: Color, composition, and motion trigger emotional responses that text rarely achieves alone.
- Shareability: Infographics are shared three times more than other content types, extending organic reach.
Cons
- Higher production cost: Quality photography, video, and interactive design require more time and budget than written content.
- Accessibility challenges: Images and video can exclude users with visual impairments if alt text and captions are not added.
- Faster obsolescence: Visual trends shift quickly, meaning assets can look dated within 12-18 months.
- AI ethics complexity: Generative AI tools raise real questions around copyright, authenticity, and consent that teams must address proactively.
Applications of Visual Storytelling Across Industries
Visual storytelling shows up differently depending on the industry, but the underlying logic is the same: replace abstraction with something a person can see and feel.
Marketing and Advertising
Modern marketing is built on visual storytelling. Nike’s inspirational athlete portraits and Airbnb’s user-generated travel photos are textbook examples of brands that let visuals carry the narrative weight. Interactive visual stories increase on-page time by up to 3x compared to text-only articles, directly lifting conversion rates and brand affinity. Brands that invest in high-quality visual content also earn more organic shares and press mentions.
Film and Video Production
In cinema, every frame is a storytelling decision. Camera angles, lighting, and color grading communicate subtext without dialogue. Alfred Hitchcock insisted that the size of an object in the frame should mirror its narrative importance, a technique that keeps viewers engaged on multiple levels simultaneously. Steven Spielberg’s signature one-point perspective shots create awe and focus, showing how composition alone becomes a story element. These are not abstract film school concepts. They are transferable principles that apply directly to brand video and social content.
Education and Data Visualization
Educators and researchers use visual storytelling to make complex data accessible. Resources from the University of Michigan show how line charts, bar graphs, and maps turn raw numbers into compelling arguments. Pairing a pie chart with an evocative photo can transform a statistic about food waste into a genuine call to action. With AI tools now auto-generating graphs from spreadsheets, even small teams can produce professional-grade visualizations in minutes rather than days.
“Data visualization is the last mile of data science. You can have the best model in the world, but if you can’t communicate it visually, it doesn’t move people.” – Per discussions in the data science community on Hacker News and the a16z blog
Healthcare and Nonprofit Visual Narratives
In healthcare, simplified infographics and animated videos improve patient understanding of treatments and procedures. Nonprofits use poignant imagery to inspire donations. A single powerful photo consistently outperforms lengthy text appeals in fundraising campaigns. These sectors prove that visual storytelling educates and mobilizes communities far beyond traditional marketing contexts.
Static vs. Interactive Visual Storytelling: A Comparison
Choosing the right format is a strategic decision, not just a creative one. The table below outlines the key differences to help you match format to objective.
| Feature | Static Visual Storytelling | Interactive Visual Storytelling |
|---|---|---|
| Definition | Fixed images, infographics, or posters that convey a message without user input. | Digital content that responds to user actions like scrolling, clicking, or hovering. |
| Examples | Print ads, social media posts, traditional infographics, billboards. | Web-based interactive reports, scrollytelling pages, clickable infographics, AR filters. |
| Engagement Level | Low to moderate; audience is passive. | High; user participation increases dwell time and recall. |
| Production Cost | Lower; requires only design software. | Higher; needs front-end development or specialized platforms like Shorthand. |
| Data Retention | Around 65% after 3 days (with image-text combo). | Higher when users actively interact, per multiple engagement studies. |
| Use Cases | Quick brand awareness, print collateral. | Deep storytelling, complex data exploration, high-stakes campaigns. |
| AI Integration (2026) | AI generates custom static visuals via text prompts (e.g., Midjourney V6). | AI personalizes interactive stories in real time based on user behavior and preferences. |
Step-by-Step: How to Build a Visual Narrative
Creating a compelling visual story is a structured process. These five steps will get you from blank canvas to published story without the usual chaos.
Step 1: Define Your Objective and Audience
Decide exactly what you want to achieve: brand awareness, lead generation, or education. Then profile your target audience, their demographics, pain points, and preferred platforms. A Gen-Z audience might favor short TikTok videos. C-suite executives respond better to polished infographics or interactive annual reports. The medium follows the audience, not the other way around.
Step 2: Develop a Core Concept and Storyboard
Brainstorm a central idea that connects emotionally. Draft a storyboard, a sequence of rough sketches, to plan the visual flow before any production begins. This step aligns teams and prevents costly revisions later. For video specifically, plan camera angles and transitions at this stage.
Step 3: Choose the Right Medium and Tools
Select a medium that fits your message and budget. For quick social content, static images or GIFs work fine. For an annual report or product launch, an interactive website built with Shorthand or a presentation tool like Prezi can elevate the experience significantly. In 2026, AI-assisted design tools reduce manual production time from days to hours.
Step 4: Assemble High-Quality Visual Assets
Gather or create your visuals. If custom photography is not in the budget, stock libraries like Unsplash and Pexels offer free, high-resolution images. Make sure all visuals follow your brand’s color palette and style guide. Authenticity matters: human faces, natural lighting, and candid moments consistently outperform polished stock photography in engagement tests.
Step 5: Apply Design Principles and Seek Feedback
Use design fundamentals, contrast, alignment, repetition, and proximity, to unify your story. Then test with a small audience before full deployment. Does the visual hierarchy lead the eye correctly? Is the message clear at a glance? Iterate based on real feedback, not assumptions. The teams I have seen skip this step almost always regret it.
Optimizing and Measuring Your Visual Storytelling Strategy
Measuring visual storytelling performance is straightforward once you know which numbers actually matter for your goals.
Key Performance Indicators (KPIs) to Track
To prove ROI, measure what matters. Common KPIs include:
- Time on Page: Interactive stories can increase this by up to 3x versus static alternatives.
- Bounce Rate: A lower bounce rate confirms the visual hook worked and the content delivered on its promise.
- Social Shares: Infographics are shared three times more than other content types, making this a reliable reach indicator.
- Click-Through Rate (CTR): The ultimate test of whether the viewer took the desired action.
Some teams have reported significant lifts in lead generation after switching from text-heavy reports to interactive visual formats. The pattern is consistent enough that I now treat visual investment as a conversion optimization lever, not just a brand play.
Common Pitfalls to Avoid
Avoid overloading visuals with information. Stick to one core message per graphic. Do not neglect mobile optimization: a majority of content is consumed on smartphones, so responsive design is mandatory, not optional. Most importantly, remember that emotion beats data every time. Without a human element, even the most technically polished story falls flat.
Tools for Analytics and Iteration
Platforms like Google Analytics and Hotjar track user interactions with precision. Heatmaps reveal where viewers look and click, guiding specific design tweaks rather than guesswork. A/B testing different visual styles identifies which elements actually drive engagement. Use these insights to refine your visual stories continuously rather than treating each piece as a one-and-done asset.
Future Trends: AI and Immersive Visual Storytelling
The next wave of visual storytelling is being shaped by AI and spatial computing, and the pace of change is faster than most teams are prepared for.
Generative AI as Co-Creator
By 2026, generative AI tools like DALL-E 3, Midjourney V6, and Adobe Firefly have become mainstream production tools. Marketers now generate custom illustrations, mood boards, and short video clips from text prompts in seconds rather than days. This shift allows small businesses to produce studio-quality visuals at a fraction of the previous cost, though it raises real questions around copyright, authenticity, and creative attribution that every team needs to address head-on.
Virtual Reality and Spatial Narratives
Immersive technologies are pushing visual storytelling into three dimensions. Devices like Apple Vision Pro and Meta Quest 3 enable stories that surround the user, turning passive viewers into active participants. Imagine a documentary where you walk through a historical site, or a product demo where you disassemble a device in mid-air. These experiences forge deep emotional connections by using spatial memory in ways flat screens simply cannot replicate.
Data-Driven Personalization
AI also enables personalized visual narratives at scale. Based on user behavior, a website can instantly adjust images, color schemes, and narrative sequences to match individual preferences. A travel brand might show beach scenes to someone who browsed tropical destinations and mountain content to an adventure seeker, all within the same story framework. Personalization at this level has been shown to lift conversion rates meaningfully, based on platform data reported by several major marketing technology vendors.
Mastering the Art of Visual Storytelling
Visual storytelling is no longer optional. It is a fundamental competency for anyone building a brand, product, or movement in the digital age. Whether you are a marketer trying to stand out, a filmmaker shaping an unforgettable scene, or an educator making complex data accessible, the ability to convey ideas visually is essential. The science is clear: our brains are built for images.
Start small. Pick one project, sketch a storyboard, and apply the principles in this guide. In an era of fleeting attention, strong visual storytelling is your most reliable path to lasting impact.
I am always interested in connecting with founders and operators who are thinking seriously about visual communication and AI strategy. Reach out and let’s talk about what you are building.
Frequently Asked Questions
What exactly is visual storytelling?
Visual storytelling is the practice of using images, videos, and graphics to convey a narrative and communicate a message. It relies on visual elements rather than text alone to evoke emotion, improve retention, and drive action.
Why is visual storytelling so effective?
It works because the brain processes visuals roughly 60,000 times faster than text and retains image-paired information far longer. After three days, people remember about 65% of information paired with an image versus only 10% from text alone, according to University of Michigan research.
What are the key elements of a great visual story?
A strong visual story has a clear singular message, sound design principles covering color, composition, and typography, a deliberate visual hierarchy, and an emotional hook. Consistency across all elements is what makes the story feel coherent rather than assembled.
How can I start using visual storytelling in my marketing?
Start by defining your objective and audience, then sketch a storyboard before touching any design tool. Use accessible tools like Canva or Adobe Express for static visuals, or invest in interactive platforms like Shorthand for more complex narratives. The storyboard step is the one most teams skip and most teams regret skipping.
What is the difference between static and interactive visual storytelling?
Static visual storytelling uses fixed images such as infographics and print ads, while interactive storytelling responds to user actions like scrolling or clicking. Interactive formats consistently produce higher engagement, longer dwell times, and better recall than their static counterparts.
How is AI changing visual storytelling in 2026?
AI tools now generate high-quality visuals from text prompts, personalize stories based on user behavior data, and enable immersive VR experiences through platforms tied to devices like Apple Vision Pro. This allows faster, more affordable, and more tailored visual narratives than were possible even two years ago.
Enjoyed this article?
Connect with me for collaboration, ventures, or just a good conversation about building things.
Get in Touch